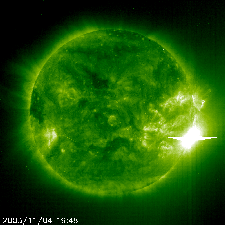
During solar flares the X-ray flux received at the Earth increases dramatically, often within a few minutes, and then decays again in times ranging from a few tens of minutes to several hours (http://sec.noaa.gov/Data/goes.html). These X-rays have major effects in the Earth’s upper atmosphere but are absorbed before they reach the ground. X-ray detectors on the GOES satellites have been recording the fluxes from solar flares since about 1976. However, during the very largest flares, such as the great flare of 4 November 2003, the GOES detectors saturate thus resulting in considerable uncertainty in the peak X-ray flux. The ESA/NASA satellite SOHO webpage has images of the great solar flare. Figure 1 shows one particularly nice image taken by the EIT instrument (Extreme ultraviolet Imaging Telescope), shows overloading of this satellites ultraviolet camera by the solar flare.

Figure 1. Extreme Ultraviolet Imaging Telescope image of the “great” solar flare which occurred on 4 November 2003. The solar flare is visible as a region of overloading on the “eastern edge of the solar disk.
VLF (Very Low Frequency) radio waves (3-30 kHz) typically propagate with good signal-to-noise ratio over ranges up to 10-15 Mm or more in the Earth-ionosphere waveguide, bounded above by the D-region and below by the Earth’s surface [e.g., Watt, 1967]. By day, the propagation paths are largely stable and the received phases are reproducible, in quiet conditions away from dawn and dusk, to a very few microseconds or better than about 10 degrees [e.g., Watt, 1967; McRae and Thomson, 2000; 2004]. However, when a solar flare occurs (on a sunlit path), the extra ionization generated by the X-rays lowers the effective reflection height of the ionosphere and advances the phase at the receiver by an amount that depends on the intensity of the X-ray flux [e.g., Mitra, 1974]. For daytime solar flares, both the height lowering and the phase advance (at least for path lengths greater than a few Mm) have been found to be nearly proportional to the logarithm of the X-ray flux [McRae and Thomson, 2004] up to at least the level of an X5 flare which lowered the effective reflection height from about 70 km (mid-day) to about 58 km [McRae and Thomson, 2004].
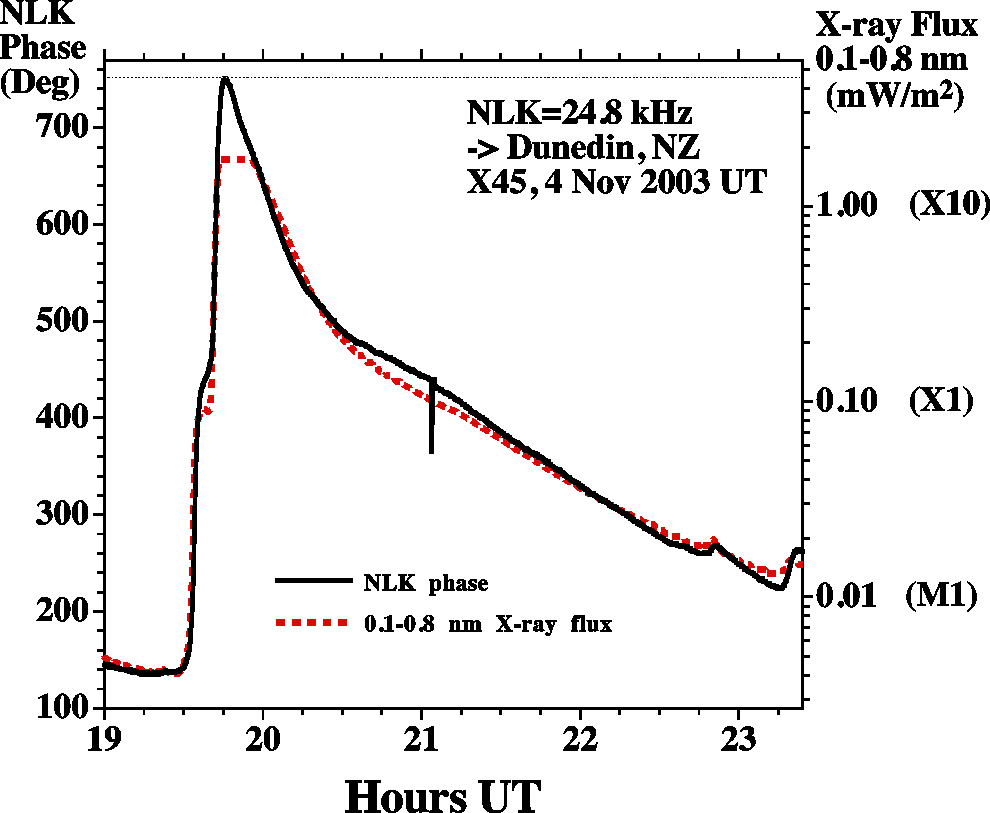
These D-region flare-induced ionospheric changes show no saturation effects thus allowing measurements of the received VLF phase changes to be used to extrapolate the GOES X-ray fluxes beyond saturation to the peak of the great flare. Thomson et al. [2004] used this technique on the GOES fluxes in the band 0.1-0.8 nm together with the daytime VLF paths across the Pacific to Dunedin, NZ, from the transmitters NLK (Seattle, 24.8 kHz), NPM (Hawaii, 21.4 kHz), and NDK (North Dakota, 25.2 kHz). They found that this technique gave a magnitude of X45±5 (4.5±0.5 mW/m2 in the 0.1-0.8 nm band) for the great flare as compared with the value of X28 (2.8 mW/m2 in the 0.1-0.8 nm band) estimated by NOAA’s Space Environment Center (SEC) (http://sec.noaa.gov/weekly/pdf2003/prf1471.pdf). Figure 2 shows an example of the comparison between the GOES X-ray data and the VLF subionospheric phase measurements from the transmitter NLK (Seattle) observed at Dunedin, New Zealand. Note the high level of agreement between the received phase and the GOES measured X-ray flux, up until the point the X-ray detector onboard the GOES satellite saturates.

Figure 2. The phase of NLK, Seattle, as received at Dunedin, NZ, during the great flare on 4 November 2003, superposed on the XL (0.1-0.8 nm) GOES X-ray flux (After Thomson et al. [2005]).
The two previously largest flares were both about X20 (2.0 mW/m2 in the 0.1-0.8 nm band), occurring on 16 August 1989 and 2 April 2001. Flares smaller than X1 (0.1 mW/m2 in the 0.1-0.8 nm band) are designated in the ranges M1.0-M9.9 or C1.0-C9.9 when their 0.1-0.8 nm band fluxes are in the ranges 10-99 µW/m2 and 1-9.9 µW/m2, respectively (http://sec.noaa.gov/weekly/Usr_guide.pdf). Generally the ionospheric VLF phase technique is sensitive down to about C1 (1 µW/m2) [e.g., McRae and Thomson, 2004] or about 1/4500 of the flux of the great flare of 4 November 2003. Below this C1 X-ray flux level (i.e., during normal quiet times), the D-region is maintained by day mainly by Lyman-α radiation (121.6 nm) from the Sun ionizing the minor neutral constituent, nitric oxide (in contrast with the flare X-rays which ionize all constituents, including N2 and O2) [e.g., Banks and Kockarts, 1973].
The GOES satellites record the X-ray fluxes in two wavelength bands: (1) 0.1-0.8 nm, referred to as ‘long’ or ‘XL’, and (2) 0.05-0.4 nm, referred to as ‘short’ or ‘XS’. The ‘long’ band has the greater fluxes and is, as explained above, used in the usual C, M, X flare designations. The ‘short’ band fluxes are more penetrating and so are more representative of the wavelengths doing the ionizing at the bottom edge of the D-region during a large flare [e.g., Banks and Kockarts, 1973]. The XL/XS power ratio varies from around 20-40 at the C1 level down to around 2-3 for the largest flares. This is discussed in more detail in section 5. In the present day GOES satellites (GOES 10 and 12), the ‘XL’ fluxes saturate at about X17 (1.7 mW/m2) whereas the ‘XS’ fluxes saturate just below 0.5 mW/m2 which typically corresponds to flare sizes of around X8-X12.
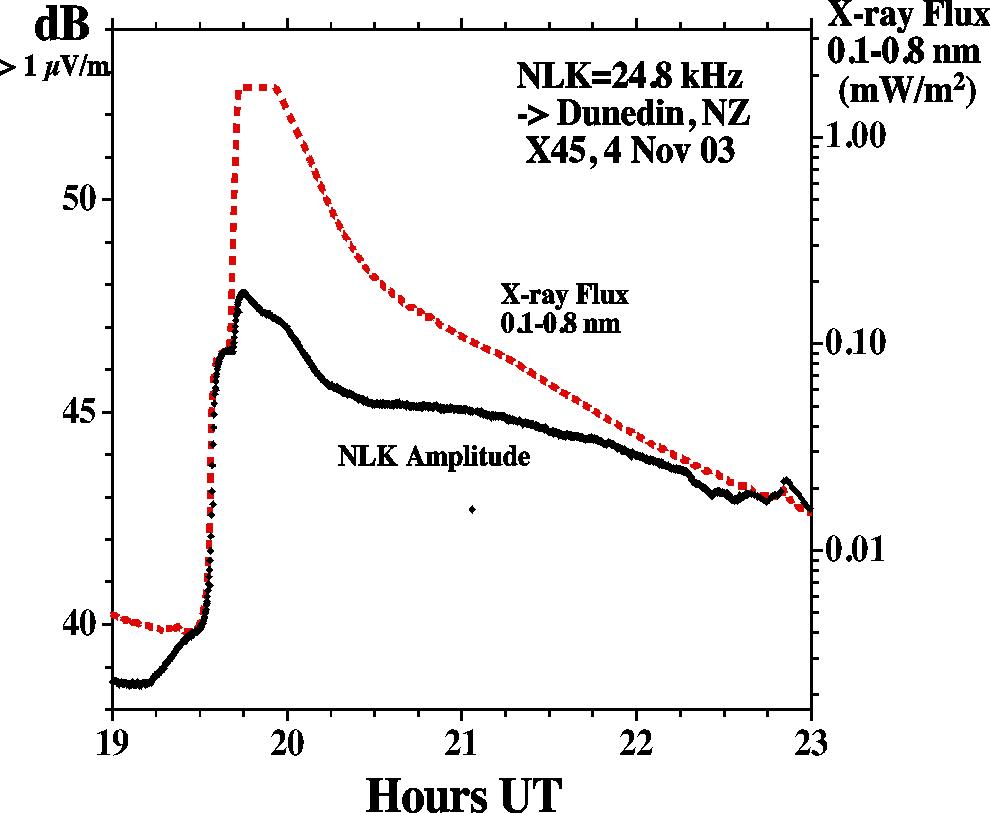
Figure 3 shows the amplitude (left-hand ordinate) of the 24.8 kHz VLF signal recorded at Dunedin, NZ, during the great flare of 4 November 2003. Also plotted, for comparison, is the ‘long’ (0.1-0.8 nm) GOES-12 X-ray flux (right-hand ordinate). The contrast with the phase plot for the same period in Figure 2 is evident. The phase varies very nearly proportionately with the (logarithm of the) X-ray flux while the amplitude does not. Thus the phase is useful and convenient for extrapolating the X-ray flux when the GOES detectors saturate but the amplitude is not. Flare-time perturbations in received subionospheric transmissions readily allow the determination of ionospheric electron density changes at the peak of the flare, particularly through the examination of phase measurements.

Figure 3. Amplitude of NLK, Seattle, recorded at Dunedin, New Zealand, together with the GOES X-ray flux during the great flare.
References
References for the papers cited in this background material piece are listed together on another webpage.
[Note: This background material is derived from our paper on solar flare impacts upon the ionosphere:
Thomson, N. R., C. J. Rodger, and M. A. Clilverd, Large solar flares and their ionospheric D-region enhancements, J. Geophys. Res., 110, A06306, doi:10.1029/2005JA011008, 2005.]